Comparative Forecasting of Schneider Electric Stock Prices

Financial Analytics · Time Series Forecasting

Benchmarking statistical and deep learning models (ARIMA, SARIMA, LSTM) for medium-term stock price forecasting using historical market data.

Business Problem

Financial institutions and investors rely on accurate forecasts of asset prices to support portfolio management, trading strategies, and risk assessment. However, financial time series are inherently volatile, non-stationary, and influenced by evolving market regimes. Traditional statistical models provide interpretability but may struggle with complex patterns, while deep learning approaches offer flexibility but require large datasets and careful tuning. Organizations therefore face a critical challenge: determining which forecasting methodology provides the most reliable predictions under real market conditions. A systematic comparison of statistical and machine learning models is needed to identify the most robust approach for medium-term stock price forecasting.

Methodology

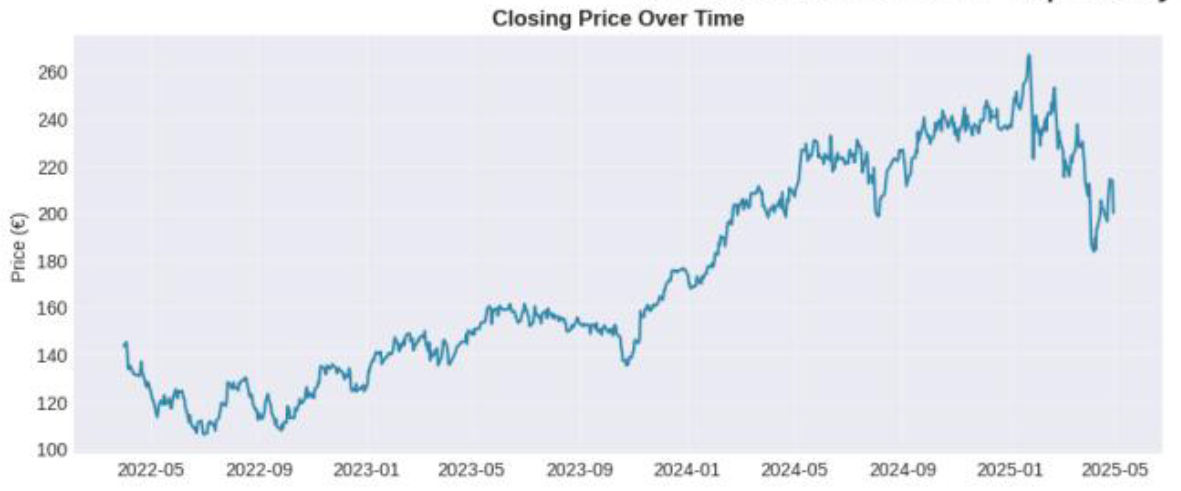
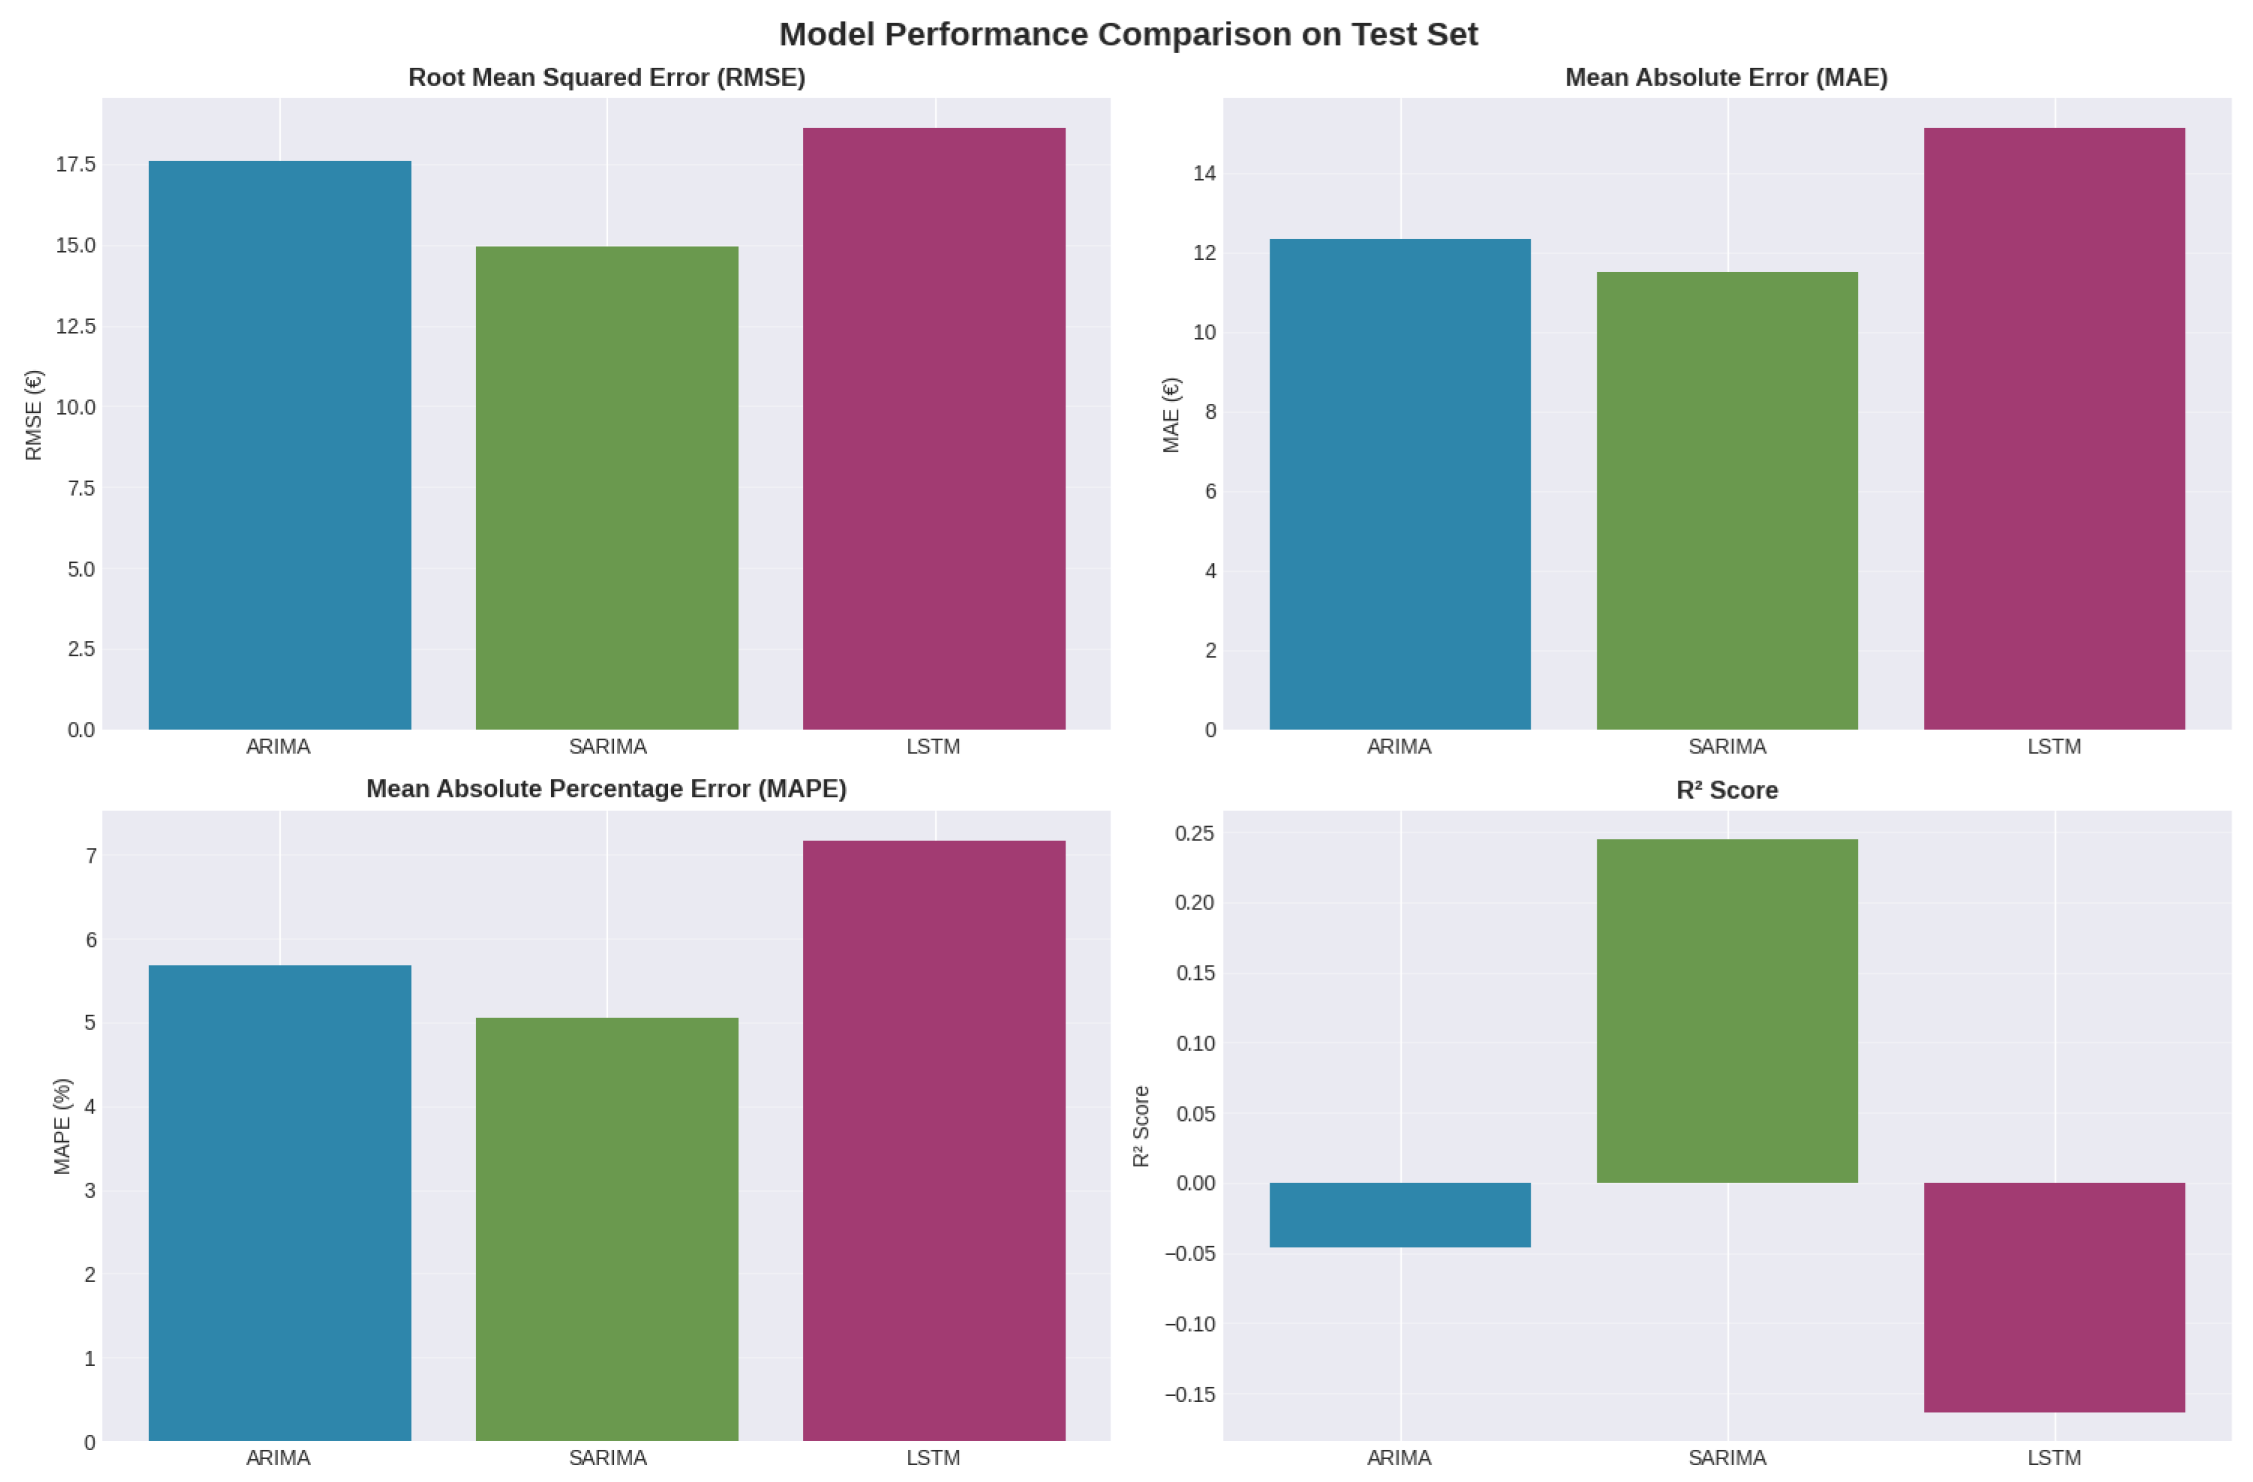
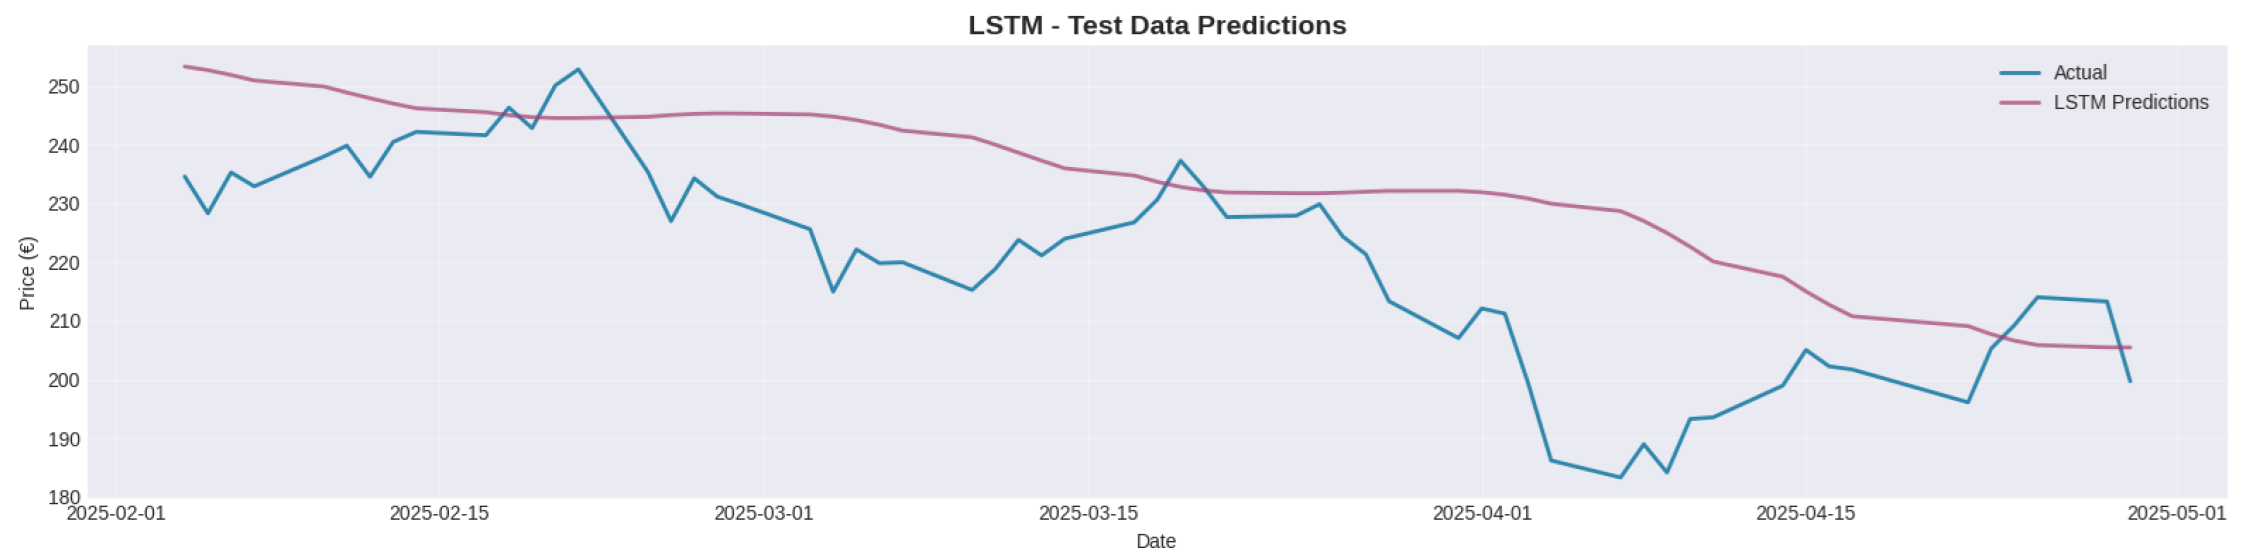
We conducted a comparative study of statistical and deep learning approaches for forecasting stock prices. Historical daily market data for Schneider Electric was collected and analyzed to understand temporal patterns, volatility, and seasonality. After preprocessing and exploratory analysis, the time series was transformed to achieve stationarity and then partitioned into chronological training, validation, and testing sets. Three forecasting models—ARIMA, SARIMA, and LSTM—were trained and evaluated to assess their predictive performance under realistic forecasting conditions.

Models Evaluated

  • ARIMA
  • SARIMA
  • LSTM Neural Network

Evaluation Framework

  • Stationarity testing using Augmented Dickey–Fuller test
  • Autocorrelation analysis using ACF and PACF plots
  • Chronological train–validation–test split (70% / 15% / 15%)
  • Forecast accuracy evaluation using RMSE, MAE, and MAPE
  • Comparative analysis of model performance across forecasting horizons

Results

Performance Summary

Best MAPE

5.05%

Indicates strong percentage-based prediction accuracy.
Best RMSE

€14.93

SARIMA achieved the lowest short-term forecasting error.
Dataset Size

786

Sufficient for statistical models but limited for deep learning approaches.
Best Short-Term Model

SARIMA

Seasonal components captured weekly trading patterns effectively.

Business Implications

The findings highlight that forecasting performance in financial markets depends strongly on the forecasting horizon and the structural properties of the data. Seasonal statistical models can capture recurring market patterns and provide highly accurate short-term predictions, while simpler models may offer greater stability for longer forecasting periods. For financial analysts and portfolio managers, these results suggest that combining statistical and machine learning approaches—rather than relying on a single model—can improve robustness in operational forecasting systems. Continuous monitoring, periodic model retraining, and ensemble strategies can further enhance forecasting reliability in dynamic market environments.
Let’s discuss your problem
Whether you’re addressing a foundational data need or a complex decision challenge, we’re ready to work with you.
Start a conversation